Hello dear readers,
I will move my blog to our company website: http://www.fromdual.com/blog
My personal blog you can find as follows: http://www.fromdual.ch/blog/41/feed
Thanks to you all and see us there!
Regards,
Oli (aka Shinguz)
Thursday, April 1, 2010


Monday, March 1, 2010
FromDual - The MySQL consulting company goes operational today!
Hello everybody,
One month earlier than planned we have the great pleasure to announce you that the company called FromDual goes operational today!
We are excited about this step and it is an new era in our personal evolution to get back in full-contact with customers and solve their real life day-to-day MySQL problems.
So we are happy hearing from you and to help you solving your individual MySQL problems...
You can find us at FromDual or you can drop us a line.
Regards,
Oli Sennhauser (aka Shinguz)
Senior MySQL Consultant at FromDual
Our consultants have been working in many projects in Europe. We were involved in small start-ups, medium size enterprises and huge world wide operating top-500 companies and solved their Performance Problems, developed Architecture & Design studies with them, answered their operation questions, and reviewed their Backup/Recovery concepts.
FromDual does on-site and remote consulting, remote emergency aid and helps its customers to fill MySQL staff gaps if needed.
The company is privately owned. Its HQ is close to Zurich in Switzerland.
One month earlier than planned we have the great pleasure to announce you that the company called FromDual goes operational today!
We are excited about this step and it is an new era in our personal evolution to get back in full-contact with customers and solve their real life day-to-day MySQL problems.
So we are happy hearing from you and to help you solving your individual MySQL problems...
You can find us at FromDual or you can drop us a line.
Regards,
Oli Sennhauser (aka Shinguz)
Senior MySQL Consultant at FromDual
About FromDual
FromDual provides neutral and vendor independent MySQL consulting, training and other services around MySQL and its derivatives. The company concentrates on the individual needs of its customers and achieves, in a close co-operation the best results for their problems.Our consultants have been working in many projects in Europe. We were involved in small start-ups, medium size enterprises and huge world wide operating top-500 companies and solved their Performance Problems, developed Architecture & Design studies with them, answered their operation questions, and reviewed their Backup/Recovery concepts.
FromDual does on-site and remote consulting, remote emergency aid and helps its customers to fill MySQL staff gaps if needed.
The company is privately owned. Its HQ is close to Zurich in Switzerland.
Monday, February 15, 2010
Logging users to the MySQL error log
Problem
A customer recently showed up with the following problem:With your guidelines [1] I am now able to send the MySQL error log to the syslog
and in particular to an external log server.
But I cannot see which user connects to the database in the error log.
How can I achieve this?
Idea
During night when I slept my brain worked independently on this problem and in the morning he had prepared a possible solution for it.What came out is the following:
- We create an UDF which allows an application to write to the MySQL error log.
See my previous article about this [2]. - We specify in a simple SQL query how the string should look which we want to write to the MySQL error log file.
- We use the init_connect [3] hook (= logon trigger) which MySQL provides to log the information to the error log.
How to solve it?
The UDF can be taken from [4]. Be not confused by the version number. It just worked with MySQL 5.1.42. Load the UDF according to the article into the MySQL database. Follow the little example there and if it works lets continue to the next step.The SQL query to form the MySQL error log string looks as follows:
mysql> SELECT CONCAT('[Security] User ', USER(), ' logged in.');And if executed with the function: mysql> SELECT log_error(CONCAT('[Security] User ', USER(), ' logged in.'));it produces the following output to the MySQL error log file:shell> tail -n 1 error.logAnd now make this permanent for every user which does not have SUPER privileges:
100215 17:50:16 [Security] User oli@localhost logged in.
#restart the database and it should work now (it could also work with just SET GLOBAL init_connect=...).
# my.cnf
#
[mysqld]
init_connect = 'SELECT log_error(CONCAT("[Security] User ", USER(), " logged in."));'
Caution
Please consider the MySQL documentation [3] and be aware of the following:"Note that the content of init_connect is not executed for users that have the SUPER privilege."Further I want to warn you that I have NOT tested the impact on stability and performance of this method! Please test it carefully yourself an let me know if you find something or also if it works smoothly for you.
This is part of the MySQL Auditing Package we are currently working on and we hope to finish it soon. If you are interested in this work please let us know and our MySQL consultants are happy to help you implementing your own MySQL auditing in your environment.
Literature
[1] MySQL reporting to syslog[2] MySQL useful add-on collection using UDF
[3] MySQL documentation: init_connect
[4] UDF collection
Thursday, February 11, 2010
Can you trust your backup?
Today a customer with corrupted data files showed up. When we enquired a bit more he told us that he had a broken I/O controller. This is one of the worst things which can happen to you!
The reason is the following: When a I/O controller starts to die it often does not happen immediately. The controller dies slowly producing more and more corrupt data. When you just write data without checking or reading them it can take days or even weeks until you discover the problem.
But the nasty thing is, that even your backup is infected with the corrupted data. In worst case corruption started long before your oldest still existing backup was made.
Fortunately DBMS are a bit sensitive related to data corruptions and start to complain pretty early. So please consider warning or error messages about data corruption as serious and try to find the problem immediately and solve it!
What can we do against spreading data corruption?
Have you EVER tested a restore of your backup? Please do! Especially if your data size is significant bigger than your amount of RAM!
In a later article I will show you a concept to do backups and test the restores regularly. Including some positive side effects on your development process.
If you need some more information or help about backup concepts, emergency restore or data recoveries please consider our consulting services.
The reason is the following: When a I/O controller starts to die it often does not happen immediately. The controller dies slowly producing more and more corrupt data. When you just write data without checking or reading them it can take days or even weeks until you discover the problem.
But the nasty thing is, that even your backup is infected with the corrupted data. In worst case corruption started long before your oldest still existing backup was made.
Fortunately DBMS are a bit sensitive related to data corruptions and start to complain pretty early. So please consider warning or error messages about data corruption as serious and try to find the problem immediately and solve it!
What can we do against spreading data corruption?
- Monitor logs (syslog, database error log, application log, etc.).
- Ideally do physical AND logical backups. If your database is too big for a logical restore you can redirect your logical backup to
/dev/null. So you can assure that at least the data can be read and the mysqldump command should complain when you hit data corruption (does not work for index corruption!). - Think about a backup retention policy.
- Think about 2 independent paths to recover your data (keep at least 2 good backups + all the binary logs).
- Do a check on your backuped files (myisamchk, innochecksum).
- Test your backup frequently with a restore (ideally on a daily basis)!
Have you EVER tested a restore of your backup? Please do! Especially if your data size is significant bigger than your amount of RAM!
In a later article I will show you a concept to do backups and test the restores regularly. Including some positive side effects on your development process.
If you need some more information or help about backup concepts, emergency restore or data recoveries please consider our consulting services.
Friday, January 29, 2010
What is CHECK TABLE doing with InnoDB tables?
Recently we had a case where a customer got some corrupted blocks in his InnoDB tables. His largest tables where quite big, about 30 to 100 Gbyte. Why he got this corrupted blocks we did not find out yet (disk broken?).
When you have corrupted blocks in InnoDB, it is mandatory to get rid of them again. Otherwise your database can crash suddenly.
If you are lucky only "normal" tables are concerned. So you can dump, drop, recreate and load them again as described in the InnoDB recovery procedure in the MySQL documentation [1].
If you are not so lucky you have to recreate your complete database or go back to an old backup and do a restore with a Point-in-Time-Recovery (PITR).
To find out if some tables are corrupted MySQL provides 2 tools: The innochecksum utility [2] and the mysqlcheck utility [3] or you can use the CHECK TABLE command manually (which is used by mysqlcheck).
I wanted to know how CHECK TABLE works in detail. So I looked first in the MySQL documentation [4]. But unfortunately the MySQL documentation does not go into details that much very often on such specific questions.
So I dug into the code. The interesting lines you can find in the files handler/ha_innodb.cc and row/row0mysql.c. In the following snippets I have cut out a lot of detail stuff.
The function ha_innobase::check is the interface between the CHECK TABLE command and the InnoDB storage engine and does the call of the InnoDB table check:
The function row_check_table_for_mysql does the different checks on an InnoDB table:
A little detail which is NOT discussed in the code above is that the fatal lock wait timeout is set from 600 seconds (10 min) to 7800 seconds (2 h 10 min).
As far as I understand this has 2 impacts:
If this is something which should be fixed to get a higher reliability of the system I cannot judge and is up to the InnoDB developers. But when you hit such symptoms during long running CHECK TABLE commands consider this.
For the first finding I have filed a feature request [5]. This "problem" was introduced long time ago with bug #2694 [6] in MySQL 4.0, Sep 2004. Thanks to Axel and Shane for their comments.
If you want to circumvent this situation you have either to recompile MySQL with higher values or you can use the concept of a pluggable User Defined Function (UDF) which I have described earlier [7], [8], [9].
An other detail is that at the end of each CHECK TABLE command a check of all Adaptive Hash Indexes of all tables is done. I do not know how expensive it is to check all Adaptive Hash Indexes, especially when they are large. But having a more optimized code there could help to speed up the CHECK TABLE command for a small percentage?
These information are valid up to MySQL/InnoDB 5.1.41 and the InnoDB plug-in 1.0.5.
[2] innochecksum — Offline InnoDB File Checksum Utility
[3] mysqlcheck
[4] CHECK TABLE
[5] Bug #50723: InnoDB CHECK TABLE fatal semaphore wait timeout possibly too short for big table
[6] Bug #2694: CHECK TABLE for Innodb table can crash server
[7] MySQL useful add-on collection using UDF
[8] Using MySQL User-Defined Functions (UDF) to get MySQL internal informations
[9] MySQL useful add-on collection using UDF

When you have corrupted blocks in InnoDB, it is mandatory to get rid of them again. Otherwise your database can crash suddenly.
If you are lucky only "normal" tables are concerned. So you can dump, drop, recreate and load them again as described in the InnoDB recovery procedure in the MySQL documentation [1].
If you are not so lucky you have to recreate your complete database or go back to an old backup and do a restore with a Point-in-Time-Recovery (PITR).
To find out if some tables are corrupted MySQL provides 2 tools: The innochecksum utility [2] and the mysqlcheck utility [3] or you can use the CHECK TABLE command manually (which is used by mysqlcheck).
I wanted to know how CHECK TABLE works in detail. So I looked first in the MySQL documentation [4]. But unfortunately the MySQL documentation does not go into details that much very often on such specific questions.
So I dug into the code. The interesting lines you can find in the files handler/ha_innodb.cc and row/row0mysql.c. In the following snippets I have cut out a lot of detail stuff.
The function ha_innobase::check is the interface between the CHECK TABLE command and the InnoDB storage engine and does the call of the InnoDB table check:
// handler/ha_innodb.cc

int ha_innobase::check( THD* thd )
{

  build_template(prebuilt, NULL, table, ROW_MYSQL_WHOLE_ROW);

  ret = row_check_table_for_mysql(prebuilt);

  if (ret == DB_SUCCESS) {
    return(HA_ADMIN_OK);
  }

  return(HA_ADMIN_CORRUPT);
}
The function row_check_table_for_mysql does the different checks on an InnoDB table:
- First it checks if the ibd file is missing.
- Then the first index (dict_table_get_first_index) is checked on its consistency (btr_validate_index) by walking through all page tree levels. In InnoDB the first (primary) index is always equal to the table (= data).
- If the index is consistent several other checks are performed (row_scan_and_check_index):
- If entries are in ascendant order.
- If unique constraint is not broken.
- And the number of index entries is calculated.
- Then the next and all other (secondary) indexes of the table are done in the same way.
- At the end a WHOLE Adaptive Hash Index check for ALL InnoDB tables (btr_search_validate) is done for every CHECK TABLE!
// row/row0mysql.c

ulint row_check_table_for_mysql( row_prebuilt_t* prebuilt )
{

  if ( prebuilt->table->ibd_file_missing ) {
    fprintf(stderr, "InnoDB: Error: ...", prebuilt->table->name);
    return(DB_ERROR);
  }

  index = dict_table_get_first_index(table);

  while ( index != NULL ) {

    if ( ! btr_validate_index(index, prebuilt->trx) ) {
      ret = DB_ERROR;
    }
    else {

      if ( ! row_scan_and_check_index(prebuilt, index, &n_rows) ) {
        ret = DB_ERROR;
      }

      if ( index == dict_table_get_first_index(table) ) {
        n_rows_in_table = n_rows;
      }
      else if ( n_rows != n_rows_in_table ) {

        ret = DB_ERROR;

        fputs("Error: ", stderr);
        dict_index_name_print(stderr, prebuilt->trx, index);
        fprintf(stderr, " contains %lu entries, should be %lu\n", n_rows, n_rows_in_table);
      }
    }

    index = dict_table_get_next_index(index);
  }

  if ( ! btr_search_validate() ) {
    ret = DB_ERROR;
  }

  return(ret);
}
A little detail which is NOT discussed in the code above is that the fatal lock wait timeout is set from 600 seconds (10 min) to 7800 seconds (2 h 10 min).
/* Enlarge the fatal lock wait timeout during CHECK TABLE. */
mutex_enter(&kernel_mutex);
srv_fatal_semaphore_wait_threshold += 7200; /* 2 hours */
mutex_exit(&kernel_mutex);
As far as I understand this has 2 impacts:
- CHECK TABLE for VERY large tables (> 200 - 400 Gbyte) will most probably fail because it will exceed the fatal lock timeout. This becomes more probable when you have bigger tables, slower disks, less memory or do not make use of your memory appropriately.
- Because srv_fatal_semaphore_wait_threshold is a global variable, during every CHECK TABLE the fatal lock wait timeout is set high for the whole system. Long enduring InnoDB locks will be detected late or not at all during a long running CHECK TABLE command.
If this is something which should be fixed to get a higher reliability of the system I cannot judge and is up to the InnoDB developers. But when you hit such symptoms during long running CHECK TABLE commands consider this.
For the first finding I have filed a feature request [5]. This "problem" was introduced long time ago with bug #2694 [6] in MySQL 4.0, Sep 2004. Thanks to Axel and Shane for their comments.
If you want to circumvent this situation you have either to recompile MySQL with higher values or you can use the concept of a pluggable User Defined Function (UDF) which I have described earlier [7], [8], [9].
An other detail is that at the end of each CHECK TABLE command a check of all Adaptive Hash Indexes of all tables is done. I do not know how expensive it is to check all Adaptive Hash Indexes, especially when they are large. But having a more optimized code there could help to speed up the CHECK TABLE command for a small percentage?
These information are valid up to MySQL/InnoDB 5.1.41 and the InnoDB plug-in 1.0.5.
Literature
[1] Forcing InnoDB Recovery[2] innochecksum — Offline InnoDB File Checksum Utility
[3] mysqlcheck
[4] CHECK TABLE
[5] Bug #50723: InnoDB CHECK TABLE fatal semaphore wait timeout possibly too short for big table
[6] Bug #2694: CHECK TABLE for Innodb table can crash server
[7] MySQL useful add-on collection using UDF
[8] Using MySQL User-Defined Functions (UDF) to get MySQL internal informations
[9] MySQL useful add-on collection using UDF
Friday, January 22, 2010
MySQL on VMware Workstation/DRBD vs. VMWare ESX Server/SAN
Or an active-active fail-over cluster à la VMware.
Today I have learned about a totally crazy/cool looking architecture where the expensive VMware ESX server was replace by a free/cheap VMware Workstation version in combination with DRBD.
Basically DRBD we name "the little man's SAN" and that is exactly what this customer is doing. He replaced the SAN with DRBD and now he can easily move one VMware instance to the other host. Possibly it is not that flexible and powerful as an ESX Server but also not so expensive...
The architecture looks as follows:

According to this customer it works stable on about a dozed of installations and they have not experienced any troubles during the fail-overs.
Please let me know your experience, thoughts or concerns with this architecture...
PS: When you consider such an architecture do not expect a very good performance!
Today I have learned about a totally crazy/cool looking architecture where the expensive VMware ESX server was replace by a free/cheap VMware Workstation version in combination with DRBD.
Basically DRBD we name "the little man's SAN" and that is exactly what this customer is doing. He replaced the SAN with DRBD and now he can easily move one VMware instance to the other host. Possibly it is not that flexible and powerful as an ESX Server but also not so expensive...
The architecture looks as follows:

According to this customer it works stable on about a dozed of installations and they have not experienced any troubles during the fail-overs.
Please let me know your experience, thoughts or concerns with this architecture...
PS: When you consider such an architecture do not expect a very good performance!
Wednesday, January 20, 2010
The battle against Oracle is probably over but has the real war begun yet?
According to different sources from the web the decision about the Oracle - Sun merger has been approved by the European commission soon. So at least in the West it is clear what is going on. Let us see what the East decides... [1], [2].
Oracles arch-enemy Microsoft has already brought its weapons in position against the target with its: "Microsoft offers Oracle-phobes MySQL migration tool" [3], [4]. So far so good. Nothing new, nothing special.
What made me a bit edgy was the following Oracle blog series about their Oracle Warehouse Builder (OWB):
It looks like with the new 11gR2 release there "... were significant changes to mapping to support native heterogeneous connectivity to systems ...".
What interests me more is what is MySQL related about it. In the second part of the series I find some text passages like:
"Next on the MySQL series, let's look at bulk extract to file from MySQL. ... and also rather than just unloading to file, we can optimize for other systems such as Oracle and create Load Code Templates that extract in bulk from MySQL (or whatever) transfer to the Oracle system and create an external table as the staging table. ... Hopefully this gives you a taster for the capabilities of the bulk extract capabilities using MySQL as an illustration."
This makes me just a bit nervous. But hopefully I am just overreacting because of the current situation... So let us carefully watch how it continues!
PS: .oO(How would it sound like this: "... and also rather than just unloading Oracle data to file, we can optimize for MySQL and create Load Code Templates that extract in bulk from Oracle (or whatever) transfer to the MySQL system ..."?)
1 Yahoo! NEWS
2 The Wall Street Journal
3 Microsoft offers Oracle-phobes MySQL migration tool
4 Free Download: Microsoft SQL Server Migration Assistant
5 OWB 11gR2 – MySQL Open Connectivity
6 OWB 11gR2 – MySQL Bulk Extract
Oracles arch-enemy Microsoft has already brought its weapons in position against the target with its: "Microsoft offers Oracle-phobes MySQL migration tool" [3], [4]. So far so good. Nothing new, nothing special.
What made me a bit edgy was the following Oracle blog series about their Oracle Warehouse Builder (OWB):
- OWB 11gR2 – MySQL Open Connectivity [5]
- OWB 11gR2 – MySQL Bulk Extract [6]
It looks like with the new 11gR2 release there "... were significant changes to mapping to support native heterogeneous connectivity to systems ...".
What interests me more is what is MySQL related about it. In the second part of the series I find some text passages like:
"Next on the MySQL series, let's look at bulk extract to file from MySQL. ... and also rather than just unloading to file, we can optimize for other systems such as Oracle and create Load Code Templates that extract in bulk from MySQL (or whatever) transfer to the Oracle system and create an external table as the staging table. ... Hopefully this gives you a taster for the capabilities of the bulk extract capabilities using MySQL as an illustration."
This makes me just a bit nervous. But hopefully I am just overreacting because of the current situation... So let us carefully watch how it continues!
PS: .oO(How would it sound like this: "... and also rather than just unloading Oracle data to file, we can optimize for MySQL and create Load Code Templates that extract in bulk from Oracle (or whatever) transfer to the MySQL system ..."?)
1 Yahoo! NEWS
2 The Wall Street Journal
3 Microsoft offers Oracle-phobes MySQL migration tool
4 Free Download: Microsoft SQL Server Migration Assistant
5 OWB 11gR2 – MySQL Open Connectivity
6 OWB 11gR2 – MySQL Bulk Extract
Thursday, January 7, 2010
MySQL reporting to syslog
There are 2 different possible situations you can face when you have to deal with MySQL and syslog:
Since the version 5.1.20 MySQL is capable to log to the syslog [1], [2]. This is done by the MySQL angel process mysqld_safe.
You can enable the syslog when you add the syslog parameter to the MySQL configuration file (my.cnf) in the mysqld_safe section:
Currently MySQL is not capable to log to more than one logging facility at the same time. So you have to decide if you want to log either to the error log or to the syslog.
If you specify both, syslog and error-log, at the same time you will receive an error message if you start mysqld like this:
But I assume that most of the MySQL users are using some kind of start/stop wrapper script like the mysql.server as follows:
or
So you will never see the error message indicating you having a conflict between the syslog and the error log. And you are possibly wondering why it is not logging to the syslog. For this problem I have filed a bug report [3].
If you cannot wait for the fix, this excerpt of mysqld_safe should help [8]:
Mysqld_safe uses the logger command to log the error messages to the syslog. With ps you will find a command which looks like this:
The logger command uses 2 parameters -t for tag and -p for priority. The tag can be influenced with the syslog-tag parameter [4].
The priority parameter configures into which facility and on which level the message should be logged.
An exceprt from the logger man page [7]:
Unfortunately the logging facility is hard-coded in the the mysqld_safe script as daemon.error and daemon.notice. It would be nice to have this parameter configurable as well thus I have filed a feature request for it [5].
When you cannot wait, this code snippets from mysqld_safe possibly will help you [8]:
With the modified mysqld_safe you can change your MySQL configuration file (my.cnf) file as follows:
to log to the local3 logging facility for example.
To activate this facility you possibly have to adapt your syslog configuration file (in my case: /etc/rsyslog.d/50-default.conf, in other cases: /etc/syslog.conf) as follows:
To make these changes active you have to restart the syslog daemon:
In my case kill -HUP was not strong enough because it did NOT display configuration errors in the log file.
After the restart of the syslog daemon you should find the created empty log file and you can test if the logging works with the following command:
Now MySQL should log everything to your syslog facility local3.
Under normal circumstances mysqld_safe can not log to more than one logging facility.
With the following syslog configuration you can make MySQL logging to both facilities, the error log AND the syslog. Add the following lines to your syslog configuration file:
Then restart the syslog daemon as described above and you will see logging to both location. The only drawback is, that the messages in the MySQL error log look like the typical syslog messages and not like the typical MySQL error log messages any more. But this should be somehow configurable with the syslog parameters in its configuration file [9].
If you need more assistance with logging to the syslog please feel free and drop me a line.
[1] MySQL error log
[2] mysqld_safe syslog parameter
[3] Bug #50083: error-log and syslog conflict in mysqld_safe is not reported to the log file.
[4] mysqld_safe syslog-tag parameter
[5] Bug #50080: syslog priority cannot be configured
[6] Writing syslog messages to MySQL
[7] Logger man page
[8] Modified mysqld_safe for advance syslog logging
[9] Examples
- MySQL is used as back-end for syslog to store the logging information. [6]
- MySQL itself should report to the syslog.
Since the version 5.1.20 MySQL is capable to log to the syslog [1], [2]. This is done by the MySQL angel process mysqld_safe.
You can enable the syslog when you add the syslog parameter to the MySQL configuration file (my.cnf) in the mysqld_safe section:
[mysqld_safe]
syslog
Currently MySQL is not capable to log to more than one logging facility at the same time. So you have to decide if you want to log either to the error log or to the syslog.
If you specify both, syslog and error-log, at the same time you will receive an error message if you start mysqld like this:
bin/mysqld_safe --defaults-file=/etc/my.cnfBut I assume that most of the MySQL users are using some kind of start/stop wrapper script like the mysql.server as follows:
/etc/init.d/mysql startor
rcmysql startSo you will never see the error message indicating you having a conflict between the syslog and the error log. And you are possibly wondering why it is not logging to the syslog. For this problem I have filed a bug report [3].
If you cannot wait for the fix, this excerpt of mysqld_safe should help [8]:
364   if [ $want_syslog -eq 1 ]
365   then
366     # User explicitly asked for syslog, so warn that it isn't used
367     logging=file   # This line you have to add!
368     log_error "Can't log to error log and syslog at the same time.  Remove all --log-error configuration options for --syslog to take effect."
369   fi
Logging to an other logging facility than daemon
Mysqld_safe uses the logger command to log the error messages to the syslog. With ps you will find a command which looks like this:
logger -t mysqld -p daemon.errorThe logger command uses 2 parameters -t for tag and -p for priority. The tag can be influenced with the syslog-tag parameter [4].
The priority parameter configures into which facility and on which level the message should be logged.
An exceprt from the logger man page [7]:
Enter the message with the specified priority. The priority may be specified numerically or as a ''facility.level'' pair. For example, ''-p local3.info'' logs the message(s) as informational level in the local3 facility. The default is ''user.notice.''Unfortunately the logging facility is hard-coded in the the mysqld_safe script as daemon.error and daemon.notice. It would be nice to have this parameter configurable as well thus I have filed a feature request for it [5].
When you cannot wait, this code snippets from mysqld_safe possibly will help you [8]:
26a27
> syslog_facility=daemon
110c111
<>&2
---
>   log_generic $syslog_facility.error "$@" >&2
114c115
<>   log_generic $syslog_facility.notice "$@"
128c129
< cmd="">&1 | logger -t '$syslog_tag_mysqld' -p daemon.error"
---
>       cmd="$cmd 2>&1 | logger -t '$syslog_tag_mysqld' -p '$syslog_facility'.error"
189a191
>       --syslog-facility=*) syslog_facility="$val" ;;
366a369
>     logging=file
With the modified mysqld_safe you can change your MySQL configuration file (my.cnf) file as follows:
[mysqld_safe]
syslog
syslog-facility                 = local3
to log to the local3 logging facility for example.
To activate this facility you possibly have to adapt your syslog configuration file (in my case: /etc/rsyslog.d/50-default.conf, in other cases: /etc/syslog.conf) as follows:
local3.* /var/log/databaseTo make these changes active you have to restart the syslog daemon:
kill -KILL $(cat /var/run/rsyslogd.pid)In my case kill -HUP was not strong enough because it did NOT display configuration errors in the log file.
After the restart of the syslog daemon you should find the created empty log file and you can test if the logging works with the following command:
logger -p local3.info testNow MySQL should log everything to your syslog facility local3.
How to make MySQL logging to the error log AND the syslog facility?
Under normal circumstances mysqld_safe can not log to more than one logging facility.
With the following syslog configuration you can make MySQL logging to both facilities, the error log AND the syslog. Add the following lines to your syslog configuration file:
$FileOwner mysql
$FileGroup dba
local3.*                        /home/mysql/product/mysql-5.1.42/data/error.log

# Set the owner and group back to its original values
$FileOwner syslog
$FileGroup adm
local3.*                        /var/log/database
Then restart the syslog daemon as described above and you will see logging to both location. The only drawback is, that the messages in the MySQL error log look like the typical syslog messages and not like the typical MySQL error log messages any more. But this should be somehow configurable with the syslog parameters in its configuration file [9].
If you need more assistance with logging to the syslog please feel free and drop me a line.
Literature
[1] MySQL error log
[2] mysqld_safe syslog parameter
[3] Bug #50083: error-log and syslog conflict in mysqld_safe is not reported to the log file.
[4] mysqld_safe syslog-tag parameter
[5] Bug #50080: syslog priority cannot be configured
[6] Writing syslog messages to MySQL
[7] Logger man page
[8] Modified mysqld_safe for advance syslog logging
[9] Examples
Wednesday, December 30, 2009
My wish for the New Year: MySQL DBA's, please install iostat on your servers!
Iostat is a very handy tool to help you investigating what kind of performance problems you have. Especially your databases can cause a lot of troubles to your I/O system and thus it would be very nice if every DBA has installed iostat on all of his MySQL database servers.
Unfortunately most of the Linux distributions do NOT install iostat by default. This causes often unfortunate situations when you are in a MySQL consulting engagement or have a MySQL support case and ask the customer for the output of iostat. In some cases they are not willing or allowed to install iostat on their production systems on the fly (even though I never have seen it causing troubles during or after the installation).
Further iostat is also not too easy to find because is is hidden in the sysstat package. But iostat can be easily post-installed as follows:
So my second wish for the New Year is: Linux distributions, please add sysstat to the default installation/base packages!
My preferred way running iostat is:
More about what iostat tells you later on this channel...
For more details go here:
[1] sysstat
[2] iostat man pages
Unfortunately most of the Linux distributions do NOT install iostat by default. This causes often unfortunate situations when you are in a MySQL consulting engagement or have a MySQL support case and ask the customer for the output of iostat. In some cases they are not willing or allowed to install iostat on their production systems on the fly (even though I never have seen it causing troubles during or after the installation).
Further iostat is also not too easy to find because is is hidden in the sysstat package. But iostat can be easily post-installed as follows:
  shell> sudo apt-get install sysstat
  shell> yum install sysstat
  shell> rpm -i sysstat-<version>.rpm
  shell> dpkg -i sysstat-<version>.deb
  shell> emerge -avq sysstat
  shell> ./configure ; make ; make install
So my second wish for the New Year is: Linux distributions, please add sysstat to the default installation/base packages!
My preferred way running iostat is:
shell> iostat -kx 1More about what iostat tells you later on this channel...
For more details go here:
[1] sysstat
[2] iostat man pages
Monday, October 19, 2009
MySQL useful add-on collection using UDF
I really like this new toy (for me) called UDF. So I try to provide some more, hopefully useful, functionality.
The newest extension I like is the possibility to write to the MySQL error log through the application. Oracle can do that since long. Now we can do this as well...
A list of what I have done up to now you can find here:
If you have some more suggestions, please let me know.
The complete details you can find here.
The newest extension I like is the possibility to write to the MySQL error log through the application. Oracle can do that since long. Now we can do this as well...
A list of what I have done up to now you can find here:
- Query and change InnoDB spin_wait_delay: udf_spin_wait_delay-5.1.30-linux-i686-glibc23.so (md5 807c6bc09b5dc88a8005788519f2483a)
- Send message to the MySQL error log: udf_log_error-5.1.30-linux-i686-glibc23.so (md5 dc8ef3e91cf6dec84ab3ad95626ec9b5)
- ...
If you have some more suggestions, please let me know.
The complete details you can find here.
Thursday, October 15, 2009
Using MySQL User-Defined Functions (UDF) to get MySQL internal informations
In one of my previous posts I was writing about how to read other processes memory [1]. As an example I tried to get the value of the hard coded MySQL internal InnoDB variable spin_wait_delay (srv_spin_wait_delay).
In this example we were using gdb or the operating system ptrace function to retrieve this value. This method has the disadvantage that it is pretty invasive.
When I was working on a customer support case I had the idea to solve this by the much less invasive method of User-Defined Functions (UDF).
UDF were introduced in MySQL 5.0 [2]. They provide the feasibility to enlarge the MySQL functionality by adding external code.
The clue is now that you also can use this external code to do some MySQL internal stuff.
My idea was now, instead of using gdb/ptrace to get the value of spin_wait_delay, to write and UDF to get and set this value.
More details about the UDF itself, how to compile and load it you can find on my website [3].
Then the UDF has to be loaded and activated in the database:
To remove the UDF again you can use the following command:
To check if an UDF is installed or to see which ones are installed the following command gives you the right answer:
When the UDF is compiled and properly loaded into the database you can get the value of spin_wait_delay as follows:
And now the real nice thing is that you can even set this value as follows:
With this function we can make a static hard coded InnoDB value dynamically changeable. To make it permanent also after a database restart possibly the functionality of init_file could help you further [4].
With this concept we can think about implementing many missing things without touching the MySQL code itself or recompiling MySQL. Please let me know what is missing in your opinion and I can try to implement it. Because I am not a programer the help of those guys would be very appreciated.
If anybody sees a problem with this method please let me know. I do not know about such things like thread safe and mutexes etc. But I think at least reading should not harm.
Caution: When you have a crash in your UDF the whole MySQL server will crash. So be careful and test it intensively!
Binary
udf_spin_wait_delay.so (md5 807c6bc09b5dc88a8005788519f2483a)
In this example we were using gdb or the operating system ptrace function to retrieve this value. This method has the disadvantage that it is pretty invasive.
When I was working on a customer support case I had the idea to solve this by the much less invasive method of User-Defined Functions (UDF).
UDF were introduced in MySQL 5.0 [2]. They provide the feasibility to enlarge the MySQL functionality by adding external code.
The clue is now that you also can use this external code to do some MySQL internal stuff.
My idea was now, instead of using gdb/ptrace to get the value of spin_wait_delay, to write and UDF to get and set this value.
More details about the UDF itself, how to compile and load it you can find on my website [3].
Then the UDF has to be loaded and activated in the database:
mysql> CREATE FUNCTION spin_wait_delay RETURNS INTEGER SONAME "udf_spin_wait_delay.so";
To remove the UDF again you can use the following command:
mysql> DROP FUNCTION spin_wait_delay;
To check if an UDF is installed or to see which ones are installed the following command gives you the right answer:
mysql> SELECT * FROM mysql.func;
+-----------------+-----+------------------------+----------+
| name | ret | dl | type |
+-----------------+-----+------------------------+----------+
| spin_wait_delay | 2 | udf_spin_wait_delay.so | function |
+-----------------+-----+------------------------+----------+
When the UDF is compiled and properly loaded into the database you can get the value of spin_wait_delay as follows:
mysql> SELECT spin_wait_delay();
+--------------------+
| spin_wait_delay(5) |
+--------------------+
| 5 |
+--------------------+
And now the real nice thing is that you can even set this value as follows:
mysql> SELECT sping_wait_delay(8);
+--------------------+
| spin_wait_delay(8) |
+--------------------+
| 8 |
+--------------------+
With this function we can make a static hard coded InnoDB value dynamically changeable. To make it permanent also after a database restart possibly the functionality of init_file could help you further [4].
With this concept we can think about implementing many missing things without touching the MySQL code itself or recompiling MySQL. Please let me know what is missing in your opinion and I can try to implement it. Because I am not a programer the help of those guys would be very appreciated.
If anybody sees a problem with this method please let me know. I do not know about such things like thread safe and mutexes etc. But I think at least reading should not harm.
Caution: When you have a crash in your UDF the whole MySQL server will crash. So be careful and test it intensively!
Binary
udf_spin_wait_delay.so (md5 807c6bc09b5dc88a8005788519f2483a)
Friday, October 2, 2009
Determine in MySQL if we are in summer time or winter time (daylight saving time, DST)
Recently a colleague at Sun was asking me if MySQL can tell him to determine if we are currently in summer time or winter time. He was doing some data analysis of his house where he has installed solar panels.
I am not aware of what he wants to do exactly, but possibly he wants all the data in solar time. So UTC could help him because UTC does not change much over time.
Next thing which came to my mind is, that possibly the good place to do such math calculations is the application code and not the database.
But never the less I was interested in how to solve this IN the database.
By default your MySQL server relies on your servers time zone. [1]
So if your server is set-up correctly you should be capable to determine if you are in summer time or winter time by your current time, UTC time and the offset you have to UTC.
If you have smarter solutions please let me know.
[1] Time zone support
[2] Date and time functions
I am not aware of what he wants to do exactly, but possibly he wants all the data in solar time. So UTC could help him because UTC does not change much over time.
Next thing which came to my mind is, that possibly the good place to do such math calculations is the application code and not the database.
But never the less I was interested in how to solve this IN the database.
By default your MySQL server relies on your servers time zone. [1]
So if your server is set-up correctly you should be capable to determine if you are in summer time or winter time by your current time, UTC time and the offset you have to UTC.
mysql> SELECT IF(ROUND(TIME_TO_SEC(SUBTIME(TIME(SYSDATE()), UTC_TIME())) / 3600, 0) = 2, 'summer time', 'winter time') AS time;Have fun calculating how much power is produced by your solar panels according to winter or sumer time...
If you have smarter solutions please let me know.
[1] Time zone support
[2] Date and time functions
Friday, August 14, 2009
Reading other processes memory
As you probably have experienced yet MySQL does not always provide all internal information as you might want to have them and as you are used to have from other RDBMS.
MySQL plans to improve this implementing the/a performance schema and its probably already partly done in MySQL 5.4. But who knows when this will be finished and what it contains at all...
What is not provided to me I want to gather myself... But how? Other RDBMS provide interfaces to attach applications directly to their memory to retreive information. But MySQL does not. So I was looking for a way to read an other process memory.
I have no clue about programming and thus changing MySQL code was out of focus. Further I am looking for a solution you can use immediately on a running systems at consulting gigs. Some tries to read /proc/<pid>/mem with a little php script failed.
An article by Domas M. helped me. I do not have to write something myself I can use a tool already exsting to do the work. But gdb is not installed on every machine and usually not at all on production machines. Further gdb is probably an overkill to just read memory of other processes.
But an other application to do this job I did not find. I just found some comments that ptrace is the way to do it. Ptrace (man ptrace) is not a program (as for example strace) but an operating system function call.
When you are interested how I found out how to do it please continue reading here.
MySQL plans to improve this implementing the/a performance schema and its probably already partly done in MySQL 5.4. But who knows when this will be finished and what it contains at all...
What is not provided to me I want to gather myself... But how? Other RDBMS provide interfaces to attach applications directly to their memory to retreive information. But MySQL does not. So I was looking for a way to read an other process memory.
I have no clue about programming and thus changing MySQL code was out of focus. Further I am looking for a solution you can use immediately on a running systems at consulting gigs. Some tries to read /proc/<pid>/mem with a little php script failed.
An article by Domas M. helped me. I do not have to write something myself I can use a tool already exsting to do the work. But gdb is not installed on every machine and usually not at all on production machines. Further gdb is probably an overkill to just read memory of other processes.
But an other application to do this job I did not find. I just found some comments that ptrace is the way to do it. Ptrace (man ptrace) is not a program (as for example strace) but an operating system function call.
When you are interested how I found out how to do it please continue reading here.
Tuesday, December 23, 2008
MySQL licenses for dummies
The following summary shows my personal understanding of MySQL 5.1 licenses, packages and products. It does not necessarily reflect 100% the way MySQL understands it. But after all the discussions I hope it is as close as possible to the reality:
MySQL Embedded Database Server (Download: enterprise.mysql.com -> OEM Software)
Classic (OEM license, -MEM -InnoDB)
Pro (= Classic +InnoDB)
Advanced (= Pro +Partitioning)

MySQL Community Sever (Download: www.mysql.com -> Downloads)
Community (GPL, -NDB)

MySQL Enterprise Server (Download: enterprise.mysql.com -> Enterprise Software)
Pro (GPL or commercial, -NDB +InnoDB +MEM, Basic + Silver customer, MRU + QSP)
Advanced (= Pro +Partitioning, Gold + Platinum customer)

MySQL Cluster (Download: http://dev.mysql.com/downloads/cluster/)
Community Edition (GPL, all features)
Com (ex CGE?) (OEM or commercial, -InnoDB +NDB)
Com-Pro (Com, all features)
Standard Edition (= Com, -NDB-API -Cluster-Repl, -LDAP)
Upgrade
EP customer should follow the QSP trail unless it is critical for them to install an MRU to get a quick bugfix to hold them over until the next QSP is released.
Month   version / release
    0   5.1.30
    1   5.1.30-MRU1
    2   5.1.30-MRU2
    3   5.1.31
    4   5.1.31-MRU1 and 5.1.30-QSP
    5   5.1.31-MRU2
    6   5.1.32
    7   5.1.32-MRU1 and 5.1.31-QSP
Legend
CE - Community EditionPlease correct me, if I am wrong. And when you have more questions let me know and I try to clear this.
EP - Enterprise Edition (why not EE?)
MRU - Monthly Rapid Update (EP only)
QSP - Quarterly Service Pack (EP only)
OEM - Original Equipment Manufacturer
MEM - MySQL Enterprise Monitior
CGE - Carrier Grade Edition
Thursday, November 13, 2008
Why does MySQL Cluster takes so long for --initial?
This week we had a very interesting problem at a customer: They complained, that their MySQL Cluster takes about 1 hour for a --initial start-up. After some tuning on the hardware and the config.ini they brought it down to around 40 minutes. But this is still unacceptable long...
This sounds a little strange to me. But let us have a look at their config.ini first. It looked more or less like the following (which is already tuned!):
So the config.ini looks fine. But why does it take so long? Let us have a look who is the evil guy:
Start phase 4 is the one! But what is start phase 4? According to the MySQL Cluster documentation start phase 4 means:
Phase 4. For an initial start or initial node restart, the redo log files are created. The number of these files is equal to NoOfFragmentLogFiles.
Creating the redo log files is the problem! I have never created a MySQL Cluster with 42 Gbyte of redo log file (42 x 4 x 256Mbyte) myself so I have no practical experience with it how long it should take.
What I did first was a rough calculation of the value I would expect:
After 15 minutes I would expect the cluster to be up and running (plus some seconds for the other phases). What I expect seems not to be the same as what happens... :(
I turned on iostat (by the way: IMHO iostat (sysstat packages) belongs on every server which does some kind of I/O!):
OK. As we can see, the I/O device is fully utilized. Good to know. Looks like we have an I/O problem! We do only around 50 w/s which is really bad (normal disks can do around 150 - 250 w/s) and we write with a throughput of 1 MByte/s (is about 20 kbyte/write) instead of 50 Mbyte/s.
What came to my mind is, that earlier this year I have written an article about Sparse files. I found then, that MySQL Cluster writes the redo log files as sparse files to disk. Could this have an impact? But we have never had any complains about this from other customers...
So what I did next: I tried on a completely different hardware from an other vendor and it took only 13 minutes! The problem seems to be NOT MySQL Cluster (alone) related! On our machines we have also an NFS mount. So let us try there: Even worse: 10 minutes! Then we did a synthetical test on the hardware:
This was running in 12 minutes! I was confused. Maybe my simulation has to be more complex:
No results which come close to the thing I have seen from MySQL Cluster...
Let us summarize:
This does not make sense to me. I need the PERFECT simulation!
For knowing more, how the redo log files were created I run a trace on the ndbd process during the creation:
As a result I got this:
OK. I see, my simulation up to now was not yet good enough... I need a Perl script to simulate this more exactly. The script you can find here: cluster_initial_test.pl.
Before I run the script I was pretty nervous: Would it work? But after a few minutes it was already clear: It has the wanted effect. After around 1/3 of the redo log files were created I estimated the end time to 59 minutes and when it ended it took around 50 minutes. Perfect!
After I came back from a short jig I was thinking about why it took longer than 40 minutes... What I can see from the system statistics is, that the I/O system is more relaxed with my script than with the original MySQL Cluster --initial restart.
So it is about 25-33% less utilized. MySQL Cluster creates the redo log files with 4 threads in parallel. For me this is a sufficient exact explanation for the moment why it takes longer.
We are able to decouple now the hardware problem from the software product. I cannot really help the hardware guys to solve their problem, but at least we were able to give them a simulation of the problem. So they can run the tests without us.
On the other hand MySQL Cluster is doing exactly what I always tell my customers not to do: "COMMIT after every INSERT". This is the worst thing what you can do with an I/O system. MySQL Cluster does a sync to disk after every 32k block (1 block per Mbyte).
So I was talking to Jonas, one of our MySQL Cluster developers, and told him the whole story. He was just asking me: "Is 14:00 early enough for the patch?"
Before 14:00 I had already the patch in my mailbox. We applied it and tested it and...
So I think now everybody should be happy?
This sounds a little strange to me. But let us have a look at their config.ini first. It looked more or less like the following (which is already tuned!):
#
# config.ini
#

[NDB_MGMD DEFAULT]
DataDir                      = /localdisk/cluster

[NDBD DEFAULT]
DataDir                      = /localdisk/cluster
NoOfReplicas                 =     2
LockPagesInMainMemory        =     1
DataMemory                   = 12000M
IndexMemory                  =  2000M

FragmentLogFileSize          =   256M
NoOfFragmentLogFiles         =    42

DiskCheckpointSpeedInRestart =   100M
ODirect                      =     1

BackupMaxWriteSize           =     1M
BackupDataBufferSize         =    16M
BackupLogBufferSize          =     4M
BackupMemory                 =    20M

[NDB_MGMD]
id                           =     1
hostname                     = 192.168.0.1

[NDBD]
id                           =    10
hostname                     = 192.168.0.10

[NDBD]
id                           =    11
hostname                     = 192.168.0.11

[MYSQLD]
[MYSQLD]
[MYSQLD]
[MYSQLD]
[MYSQLD]
So the config.ini looks fine. But why does it take so long? Let us have a look who is the evil guy:
# grep phase ndb_1_cluster.log | grep "Node 10"

2008-10-24 12:24:16 [MgmSrvr] INFO     -- Node 10: Start phase 1 completed
2008-10-24 12:24:16 [MgmSrvr] INFO     -- Node 10: Start phase 2 completed (initial start)
2008-10-24 12:24:16 [MgmSrvr] INFO     -- Node 10: Start phase 3 completed (initial start)
2008-10-24 13:03:03 [MgmSrvr] INFO     -- Node 10: Start phase 4 completed (initial start)
2008-10-24 13:03:08 [MgmSrvr] INFO     -- Node 10: Start phase 5 completed (initial start)
2008-10-24 13:03:08 [MgmSrvr] INFO     -- Node 10: Start phase 6 completed (initial start)
2008-10-24 13:03:08 [MgmSrvr] INFO     -- Node 10: Start phase 7 completed (initial start)
2008-10-24 13:03:08 [MgmSrvr] INFO     -- Node 10: Start phase 8 completed (initial start)
2008-10-24 13:03:08 [MgmSrvr] INFO     -- Node 10: Start phase 9 completed (initial start)
2008-10-24 13:03:08 [MgmSrvr] INFO     -- Node 10: Start phase 100 completed (initial start)
2008-10-24 13:03:08 [MgmSrvr] INFO     -- Node 10: Start phase 101 completed (initial start)
Start phase 4 is the one! But what is start phase 4? According to the MySQL Cluster documentation start phase 4 means:
Phase 4. For an initial start or initial node restart, the redo log files are created. The number of these files is equal to NoOfFragmentLogFiles.
Creating the redo log files is the problem! I have never created a MySQL Cluster with 42 Gbyte of redo log file (42 x 4 x 256Mbyte) myself so I have no practical experience with it how long it should take.
What I did first was a rough calculation of the value I would expect:
43'008 Mbyte : 50 Mbyte/s = 860 s = 15 minutes
After 15 minutes I would expect the cluster to be up and running (plus some seconds for the other phases). What I expect seems not to be the same as what happens... :(
I turned on iostat (by the way: IMHO iostat (sysstat packages) belongs on every server which does some kind of I/O!):
# iostat -x 1

avg-cpu:  %user   %nice %system %iowait  %steal   %idle
          0.00    0.00    0.12   18.35    0.00   81.52

Device:    rrqm/s wrqm/s   r/s   w/s  rsec/s  wsec/s    rkB/s    wkB/s avgrq-sz avgqu-sz   await  svctm  %util
sda          0.00 193.00  0.00 55.00    0.00 2016.00     0.00  1008.00    36.65     2.13   38.55  18.18 100.00

avg-cpu:  %user   %nice %system %iowait  %steal   %idle
          0.00    0.00    0.25   18.88    0.00   80.88

Device:    rrqm/s wrqm/s   r/s   w/s  rsec/s  wsec/s    rkB/s    wkB/s avgrq-sz avgqu-sz   await  svctm  %util
sda          0.00 192.00  0.00 48.00    0.00 2088.00     0.00  1044.00    43.50     1.72   35.50  20.83 100.00

avg-cpu:  %user   %nice %system %iowait  %steal   %idle
          0.00    0.00    0.00   19.12    0.00   80.88

Device:    rrqm/s wrqm/s   r/s   w/s  rsec/s  wsec/s    rkB/s    wkB/s avgrq-sz avgqu-sz   await  svctm  %util
sda          0.00 200.00  0.00 47.00    0.00 2088.00     0.00  1044.00    44.43     1.69   35.91  21.28 100.00
OK. As we can see, the I/O device is fully utilized. Good to know. Looks like we have an I/O problem! We do only around 50 w/s which is really bad (normal disks can do around 150 - 250 w/s) and we write with a throughput of 1 MByte/s (is about 20 kbyte/write) instead of 50 Mbyte/s.
What came to my mind is, that earlier this year I have written an article about Sparse files. I found then, that MySQL Cluster writes the redo log files as sparse files to disk. Could this have an impact? But we have never had any complains about this from other customers...
So what I did next: I tried on a completely different hardware from an other vendor and it took only 13 minutes! The problem seems to be NOT MySQL Cluster (alone) related! On our machines we have also an NFS mount. So let us try there: Even worse: 10 minutes! Then we did a synthetical test on the hardware:
# dd if=/dev/zero of=redo_log.42g count=0 obs=1 seek=42G
# dd if=/dev/zero of=redo_log.42g bs=32K count=1376256 of=direct
This was running in 12 minutes! I was confused. Maybe my simulation has to be more complex:
#!/bin/bash

let i=1
# 1376256
while [[ $i -le  ]] ; do
 dd if=/dev/zero of=big_file.42g obs=512 count=1 seek=32K
 let i=$i+1
done
No results which come close to the thing I have seen from MySQL Cluster...
Let us summarize:
Our servers with Mysql Cluster:  37 minutes
Test servers with Mysql Cluster: 13 minutes
Our servers with dd:             12 minutes
Our servers with NFS:            10 minutes
This does not make sense to me. I need the PERFECT simulation!
For knowing more, how the redo log files were created I run a trace on the ndbd process during the creation:
# strace -o ndbd.trace -ff -s 128 -p
As a result I got this:
open("/localdisk/cluster/ndb_11_fs/D10/DBLQH/S3.FragLog", O_RDWR|O_CREAT|O_TRUNC|O_DIRECT, 0666) = 17
lseek(17, 268402688, SEEK_SET) = 268402688   # 256M - 32k
write(17, "..."..., 32768) = 32768
fsync(17)                         = 0
lseek(17, 0, SEEK_SET) = 0
write(17, "..."..., 32768) = 32768
fsync(17)                         = 0
lseek(17, 1048576, SEEK_SET) = 1048576
write(17, ""..., 32768) = 32768
fsync(17)                         = 0
lseek(17, 2097152, SEEK_SET) = 2097152
write(17, ""..., 32768)= 32768
fsync(17)                         = 0

...
lseek(17, 267386880, SEEK_SET) = 267386880
write(17, ""..., 32768)                         = 32768
fsync(17) = 0
close(17) = 0
OK. I see, my simulation up to now was not yet good enough... I need a Perl script to simulate this more exactly. The script you can find here: cluster_initial_test.pl.
Before I run the script I was pretty nervous: Would it work? But after a few minutes it was already clear: It has the wanted effect. After around 1/3 of the redo log files were created I estimated the end time to 59 minutes and when it ended it took around 50 minutes. Perfect!
After I came back from a short jig I was thinking about why it took longer than 40 minutes... What I can see from the system statistics is, that the I/O system is more relaxed with my script than with the original MySQL Cluster --initial restart.
# iostat -x 1

Device:    rrqm/s wrqm/s   r/s   w/s  rsec/s  wsec/s    rkB/s    wkB/s avgrq-sz avgqu-sz   await  svctm  %util
sda          0.00 161.39  0.00 49.50    0.00 1798.02     0.00   899.01    36.32     1.05   20.40  14.32  70.89
sda          0.00 176.00  0.00 51.00    0.00 1920.00     0.00   960.00    37.65     1.07   21.18  14.04  71.60
sda          0.00 170.71  0.00 46.46    0.00 1882.83     0.00   941.41    40.52     0.99   21.22  15.74  73.13
So it is about 25-33% less utilized. MySQL Cluster creates the redo log files with 4 threads in parallel. For me this is a sufficient exact explanation for the moment why it takes longer.
We are able to decouple now the hardware problem from the software product. I cannot really help the hardware guys to solve their problem, but at least we were able to give them a simulation of the problem. So they can run the tests without us.
On the other hand MySQL Cluster is doing exactly what I always tell my customers not to do: "COMMIT after every INSERT". This is the worst thing what you can do with an I/O system. MySQL Cluster does a sync to disk after every 32k block (1 block per Mbyte).
So I was talking to Jonas, one of our MySQL Cluster developers, and told him the whole story. He was just asking me: "Is 14:00 early enough for the patch?"
Before 14:00 I had already the patch in my mailbox. We applied it and tested it and...
5 minutes 12 seconds!
So I think now everybody should be happy?
Addendum:
- The perl script could be improved by:
sysopen(HANDLE, $path, O_RDWR|O_CREAT|O_EXCL|O_DIRECT) or die "sysopen $path: $!";
- Maybe the problem could be also simulated much easier with dd like this:
# dd if=/dev/zero of=redo_log.42g bs=1M count=43008 of=direct conv=fsync
- You can find the patch here: Bug #40734
Monday, October 13, 2008
MySQL Multi-Master – Single-Slave – Replication (Episode 2)
Introduction
One of the features that make MySQL so great is its easy replication set-up. If you are experienced and know-how to do it, it takes you about 15 minutes to set-up a slave. What you have in the end is a replication from one master to one or several slaves. So you can build a top-down data stream pyramid and spread your data on many slaves.
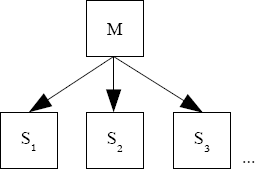
From time to time some customers are asking for the other way: Many masters replicating to one slave (which is also called multi-source replication). For this requirement MySQL replication cannot help you directly.
Possibilities
You can circumvent this situation in the following ways:
Possibility number 4 for would be the nicest one. Because then the solution would be properly supported by your database vendor and you do not have to take care much about problems, as long as you have a support contract.
When we look at the MySQL work log and search for replication we find a work log entry with the title: WL#1697: Multi-source replication. But for whatever reason it has the following status: Affects: Server-7.0 — Status: On-Hold — Priority: Low. :-(
What can we do now:
a) Resign.
b) Become an important customer (by paying much money), complain about the priority and if nothing changes escalate it to the top management of MySQL.
c) Find many many other fellow sufferers, unite and make your database vendors management aware of your desire.
d) Help yourself (it is eventually an Open Source product...).
Possibilities number 1 to 3 from above are some kind of Help yourself.
Help yourself
Because I am not a programmer and I have no clue about programming, possibility number 1 is out of question for me. But I am sure there are many other MySQL users out there in the world which would appreciate your effort.
Possibility number 2 is a quick and ugly hack but may work in some situations.
And number 3 I was pointed to by a user called Kwame who wrote me an email (thanks Kwame for the cool hint!).
A possible solution
One and a half year ago I wrote down a little article about MySQL Active - Active Clustering" because we had ever and ever customer asking for a replacement for a well known but very expensive product from an other big database vendor.
Peter Zaitsev was not very happy with the content of it: MySQL MyISAM Active Active Clustering - looking for trouble?. But comments about the critics already gave a sign for the solution: When you combine the MySQL Active-Active Clustering with MySQL replication you can finally get a many-master single slave replication!
So what I did was the following:
I have 3 servers which act as a master and on the 4th server I install 3 MySQL instances (mysqld) running on the same datadir. Please make sure, that you replicate ONLY ONE SCHEMA per master slave pair!
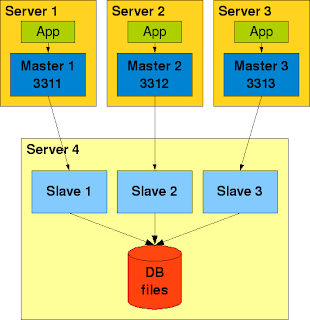
As configuration file for my slaves I have used something like this:
Requirements
Make sure that:
Very simple first tests showed, that it is possible to "aggregate" the data from many masters into a single slave. But please verify this proof of concept very carefully before you deploy it to your productive system with your real data. This approach is neither recommended nor supported by MySQL.
Drawback
A further replication from this slave system to other slaves is not possible (or at least no feasible solution comes to my mind) except you use MySQL cluster as "aggregator". Then it could be possible...
One of the features that make MySQL so great is its easy replication set-up. If you are experienced and know-how to do it, it takes you about 15 minutes to set-up a slave. What you have in the end is a replication from one master to one or several slaves. So you can build a top-down data stream pyramid and spread your data on many slaves.

From time to time some customers are asking for the other way: Many masters replicating to one slave (which is also called multi-source replication). For this requirement MySQL replication cannot help you directly.
Possibilities
You can circumvent this situation in the following ways:
- Implement your own data transfer mechanism.
- Use this ugly hack I have written down 2 years ago: Multi-Master-Single-Slave-Replication
- Test the approach described in the following article.
- Wait until MySQL has implemented it...
Possibility number 4 for would be the nicest one. Because then the solution would be properly supported by your database vendor and you do not have to take care much about problems, as long as you have a support contract.
When we look at the MySQL work log and search for replication we find a work log entry with the title: WL#1697: Multi-source replication. But for whatever reason it has the following status: Affects: Server-7.0 — Status: On-Hold — Priority: Low. :-(
What can we do now:
a) Resign.
b) Become an important customer (by paying much money), complain about the priority and if nothing changes escalate it to the top management of MySQL.
c) Find many many other fellow sufferers, unite and make your database vendors management aware of your desire.
d) Help yourself (it is eventually an Open Source product...).
Possibilities number 1 to 3 from above are some kind of Help yourself.
Help yourself
Because I am not a programmer and I have no clue about programming, possibility number 1 is out of question for me. But I am sure there are many other MySQL users out there in the world which would appreciate your effort.
Possibility number 2 is a quick and ugly hack but may work in some situations.
And number 3 I was pointed to by a user called Kwame who wrote me an email (thanks Kwame for the cool hint!).
A possible solution
One and a half year ago I wrote down a little article about MySQL Active - Active Clustering" because we had ever and ever customer asking for a replacement for a well known but very expensive product from an other big database vendor.
Peter Zaitsev was not very happy with the content of it: MySQL MyISAM Active Active Clustering - looking for trouble?. But comments about the critics already gave a sign for the solution: When you combine the MySQL Active-Active Clustering with MySQL replication you can finally get a many-master single slave replication!
So what I did was the following:
I have 3 servers which act as a master and on the 4th server I install 3 MySQL instances (mysqld) running on the same datadir. Please make sure, that you replicate ONLY ONE SCHEMA per master slave pair!

As configuration file for my slaves I have used something like this:
#
# my.cnf
#

[mysqld]

port          = 3308
socket        = /home/mysql/tmp/mysql-3308.sock
pid-file      = /home/mysql/data/mysqld5127/mysql-3308.pid
datadir       = /home/mysql/data/mysqld5127

skip-innodb
external-locking
log-error     = /home/mysql/data/mysqld5127/error_4.log

server_id           = 4
master-info-file    = /home/mysql/data/mysqld5127/master.info
relay-log           = /home/mysql/data/mysqld5127/mysql-3308-relay-bin
relay-log-index     = /home/mysql/data/mysqld5127/mysql-3308-relay-bin
relay-log-info-file = /home/mysql/data/mysqld5127/relay-log.info
Requirements
Make sure that:
- You only write to one schema per master (schema_a in master 1, schema_b in master 2 and so on...)
- You comply with all the requirements described in the document MySQL Active - Active Clustering
- You flush the tables on ALL slave before reading.
Very simple first tests showed, that it is possible to "aggregate" the data from many masters into a single slave. But please verify this proof of concept very carefully before you deploy it to your productive system with your real data. This approach is neither recommended nor supported by MySQL.
Drawback
A further replication from this slave system to other slaves is not possible (or at least no feasible solution comes to my mind) except you use MySQL cluster as "aggregator". Then it could be possible...
Thursday, October 9, 2008
Test application for MySQL high availability (HA) set-up
When I set-up a MySQL HA environment for customers I usually do some final fail over tests after configuring the whole beast.
To check if the application behaves like expected I always run my little test application (test.sh) from the server(s) where the customers application runs. It displays "graphically" how the application behaves and you can show to the customer immediately what is going on...
Make sure, that you point it to the VIP (virtual IP) or the LB (load balancer).
It was really useful for me and I recommend you to do your HA fail over tests also at least with this little tool to avoid evil surprises in the future.
To check if the application behaves like expected I always run my little test application (test.sh) from the server(s) where the customers application runs. It displays "graphically" how the application behaves and you can show to the customer immediately what is going on...
Make sure, that you point it to the VIP (virtual IP) or the LB (load balancer).
It was really useful for me and I recommend you to do your HA fail over tests also at least with this little tool to avoid evil surprises in the future.
Thursday, September 25, 2008
Citation of the week
"Das dreieckige Rad hat gegenüber dem viereckigen einen gewaltigen Vorteil: Ein Rumms weniger pro Umdrehung!"
Translation:
"The triangular wheel has one enormous advantage over the quadrangular: One knock less per revolution!"
Maybe not new, but I have not heard it yet and I love it. It was about reinventing functionality in a well known product...
Translation:
"The triangular wheel has one enormous advantage over the quadrangular: One knock less per revolution!"
Maybe not new, but I have not heard it yet and I love it. It was about reinventing functionality in a well known product...
Tuesday, September 23, 2008
MySQL Cluster: No more room in index file
Recently we were migrating an InnoDB/MyISAM schema to NDB. I was too lazy to calculate all the needed MySQL Cluster parameters (for example with ndb_size.pl) and just took my default config.ini template.
Because I am really lazy I have a little script doing this for me (alter_engine.sh).
But suddenly my euphoria was stopped abruptly by the following error:
The usual command that helps me in such a situation is a follows:
But in this case it is not really helpful. Also
does not bring us further. Strange: Index file... We are converting from MyISAM/InnoDB to NDB. Why the hell is he using an index file for this operation? It seems to be clearly a mysqld error message and not a MySQL Cluster error message. And we are also not using MySQL Cluster disk data tables.
After bothering a bit MySQL support I had the idea to do the following:
The MySQL online documentation clearly states:
So this could be the reason! When I have changed this parameter followed by the common rolling restart of the MySQL Cluster I could continue to migrate my schema into cluster...
Conclusion
MySQL errors can be related to cluster errors and do not necessarily point to the source of the problem. The error:
means just MaxNoOfOrderedIndexes is too small!
I hope that I can safe you some time with this little article.
Because I am really lazy I have a little script doing this for me (alter_engine.sh).
But suddenly my euphoria was stopped abruptly by the following error:
MySQL error code 136: No more room in index file
The usual command that helps me in such a situation is a follows:
# perror 136
MySQL error code 136: No more room in index file
But in this case it is not really helpful. Also
# perror --ndb 136
does not bring us further. Strange: Index file... We are converting from MyISAM/InnoDB to NDB. Why the hell is he using an index file for this operation? It seems to be clearly a mysqld error message and not a MySQL Cluster error message. And we are also not using MySQL Cluster disk data tables.
After bothering a bit MySQL support I had the idea to do the following:
# ndb_show_tables | grep -ic orderedindex
127
The MySQL online documentation clearly states:
MaxNoOfOrderedIndexes
...
The default value of this parameter is 128.
So this could be the reason! When I have changed this parameter followed by the common rolling restart of the MySQL Cluster I could continue to migrate my schema into cluster...
Conclusion
MySQL errors can be related to cluster errors and do not necessarily point to the source of the problem. The error:
MySQL error code 136: No more room in index file
means just MaxNoOfOrderedIndexes is too small!
I hope that I can safe you some time with this little article.
Possible memory leak in NDB-API applications?
A customer has recently experienced a possible memory leak in its NDB-API application. What he did was something like
over time and then he saw the RSS increasing. When he would have had a look a little longer he would have seen that the RSS consumption would increase up to a certain level and then becomes stable. Which is the expected behaviour.

But how to explain to the customer that his application, which was in fact not doing anything, consumes more RSS?
With a diff over time on /proc/<pid>/smaps we found that this area was the reason:
But what is this meaning? To find the answer we did a strace on the program and got the following system calls:
OK. Somebody is allocating 2 times 2 junks of about 2 Mbyte of memory. But what the hell could this be??? During night I found the solution. It is the SendBufferMemory and ReceiveBufferMemory which I have configured in the config.ini to that size...
When you experience similar behaviour on your processes, maybe this little script can help you to find the problem: mem_tracker.sh
By the way, with an other customer we wound some other nice behaviour. But this time it was a mysqld:

# ps aux | grep <pid>
over time and then he saw the RSS increasing. When he would have had a look a little longer he would have seen that the RSS consumption would increase up to a certain level and then becomes stable. Which is the expected behaviour.

But how to explain to the customer that his application, which was in fact not doing anything, consumes more RSS?
With a diff over time on /proc/<pid>/smaps we found that this area was the reason:
b67b7000-b6fca000 rw-p b67b7000 00:00 0 (8 Mbyte)
Size:               8268 kB
Rss:                 148 kB
Shared_Clean:          0 kB
Shared_Dirty:          0 kB
Private_Clean:         0 kB
Private_Dirty:       148 kB
Referenced:          148 kB
But what is this meaning? To find the answer we did a strace on the program and got the following system calls:
...
read(5, "127.0.0.1 localhost\n\n# The follo"..., 4096) = 450
close(5) = 0
munmap(0xb7acb000, 4096) = 0
mmap2(NULL, 2117632, PROT_READ|PROT_WRITE, MAP_PRIVATE|MAP_ANONYMOUS, -1, 0) = 0xb69bf000 - 0xB6BC4000 (2068 Mbyte)
mmap2(NULL, 2101248, PROT_READ|PROT_WRITE, MAP_PRIVATE|MAP_ANONYMOUS, -1, 0) = 0xb67be000 - 0xb69bf000 (2052 Mbyte)
mmap2(NULL, 32768, PROT_READ|PROT_WRITE, MAP_PRIVATE|MAP_ANONYMOUS, -1, 0) = 0xb7ac4000
mprotect(0xb7ac4000, 4096, PROT_NONE) = 0
clone(child_stack=0xb7acb4b4, flags=CLONE_VM|CLONE_FS|CLONE_FILES|CLONE_SIGHAND|CLONE_THREAD|CLONE_SYSVSEM|CLONE_SETTLS|CLONE_PARENT_SETTID|CLONE_C
...
OK. Somebody is allocating 2 times 2 junks of about 2 Mbyte of memory. But what the hell could this be??? During night I found the solution. It is the SendBufferMemory and ReceiveBufferMemory which I have configured in the config.ini to that size...
When you experience similar behaviour on your processes, maybe this little script can help you to find the problem: mem_tracker.sh
By the way, with an other customer we wound some other nice behaviour. But this time it was a mysqld:

Subscribe to:
Posts (Atom)